How Almost Everyone Just Got Screwed In One Chart

The devil is in the details. Here’s a comparison of what is in the debt deal from last week, both for the haves and for the have-nots.
The devil is in the details. Here’s a comparison of what is in the debt deal from last week, both for the haves and for the have-nots.
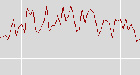
Two simple charts tell the story.

This was released a few years ago but is even more relevant today as the “Party Of No” continues to ignore the will of the people. This version mixes the original will.i.am Emmy winner ”Yes We Can” with words from the Speaker of the House.

There’s no way to know the answer to that question unless this executive order is signed into law. Robert Reich explains:
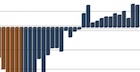
Yep, that’s how many private sector jobs have been added over the past 13 months. Check out this chart from Minority Leader Nancy Pelosi.