Tag: Infographics
By MoveOn Staff. Tuesday, November 19 2013
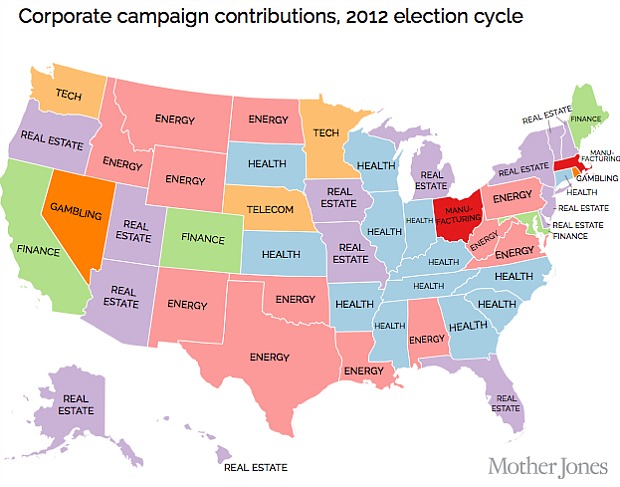
Find out which sector poured the most cash into your state’s political campaigns last year with this map from Mother Jones.
+Read More
Corporate Influence | Elections | Eye-Opening | Infographics | mother jones | Politics
By Maria Tchijov. Tuesday, November 12 2013
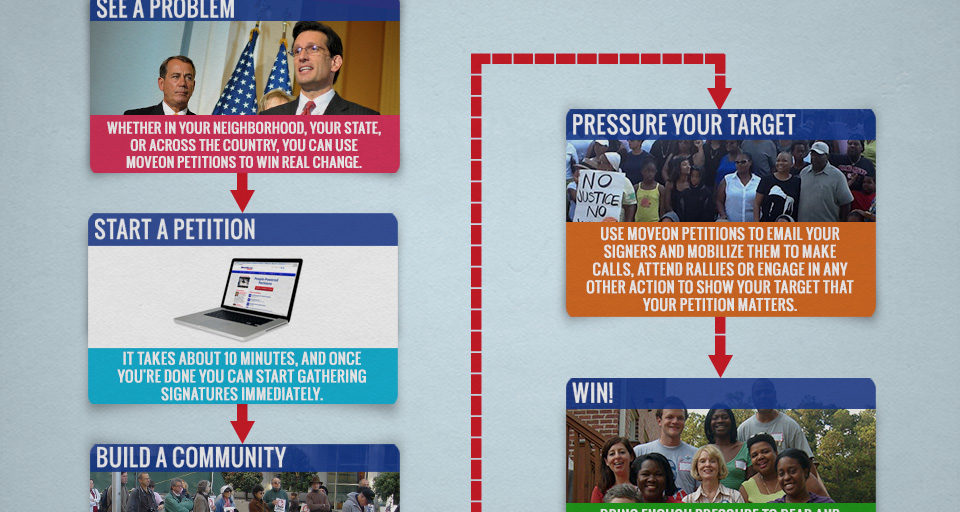
Have you ever wondered how turn a problem in your community into a campaign victory? Here are five simple steps to do just that using MoveOn Petitions.
+Read More
Graphics | Infographics | MoveOn Original
By MoveOn Staff. Thursday, September 26 2013
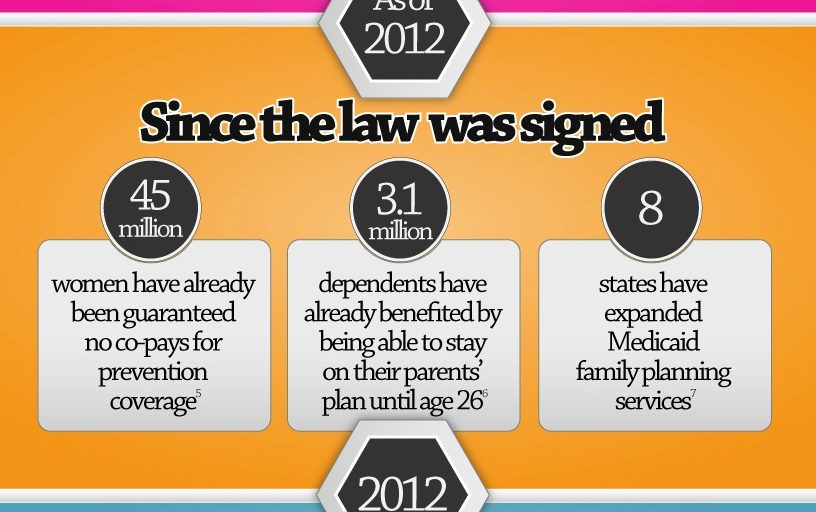
Did you know that, before Obamacare, women paid nearly 70% more than men for out-of-pocket medical costs? Yikes.
+Read More
Affordable Care Act | Health Care | Infographics | Obamacare | Planned Parenthood | Women
By MoveOn Staff. Friday, May 3 2013
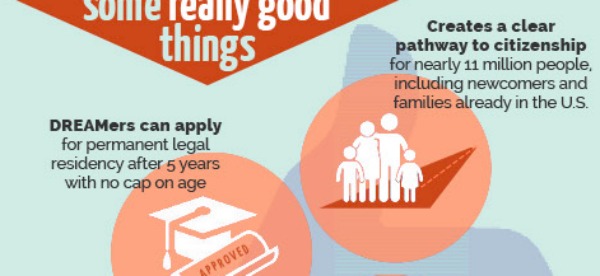
Have you seen it?
+Read More
Economic Fairness | Eye-Opening | Immigration | Infographics | MoveOn Original | path to citizenship
By MoveOn Staff. Wednesday, March 27 2013
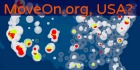
See where its population (membership) would put it among other big cities in the U.S.
+Read More
Infographics | MoveOn Original
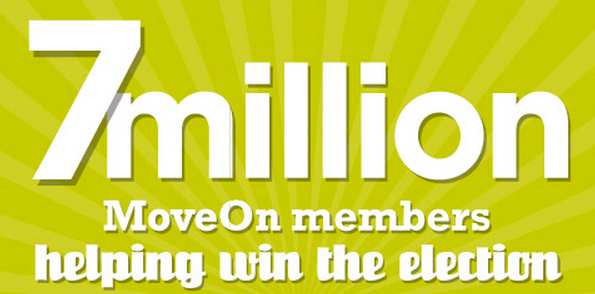
By MoveOn Staff. Sunday, December 30 2012

2012 was a big year for MoveOn and the entire country.
+Read More
2012 Elections | Infographics | MoveOn Original | Nonpartisan
By MoveOn Staff. Sunday, December 2 2012
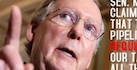
As the GOP tries for force the Keystone bill through, consider this:
+Read More
2012 Elections | Corporate Influence | Eye-Opening | Graphics | Infographics | Keystone XL pipeline | Mitch McConnell | Oil companies | Quotes | Radical Right | Republicans
By MoveOn Staff. Monday, November 19 2012

Join the fight!
+Read More
Graphics | Infographics | Nonpartisan | The Riot Mag | war on women
By MoveOn Staff. Wednesday, November 7 2012
Who volunteered hard to fight against voter suppression, big money, and anti-progress? YOU did! Thank you for all you do!
+Read More
2012 Elections | Barack Obama | Beautiful | Charts | Eye-Opening | Graphics | Infographics | Inspiring | Media | Progressive
By MoveOn Staff. Tuesday, November 6 2012
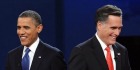
See which candidate is holding your balloon.
+Read More
2012 Election | 2012 Elections | Barack Obama | Democrats | GOP | infographic | Infographics | Joe Biden | Mitt Romney | Obama Administration | Paul Ryan | Progressive | Republicans